ValueMyFranchise
What is this franchise actually worth?
Enter the operating numbers and the deal terms. You get a valuation range built from benchmarks for that specific brand, and every step of the reasoning behind it, so you can defend the number or argue with it.
Worked exampleQuick-service restaurant, 1 unit
- Gross revenue
- $900,000
- Reported operating profit
- $77,500
- + Add-backs
- $98,000
- Seller’s discretionary earnings
- $175,500
- × Multiple brand 2.30x, adjusted +0.65x
- 2.95x
- Estimated value
- $363,581 – $524,313
Most likely $441,455 See the working
The working, step by step
The same example as it appears in the calculator. Each step is a panel you can open and check.
-
Step 1
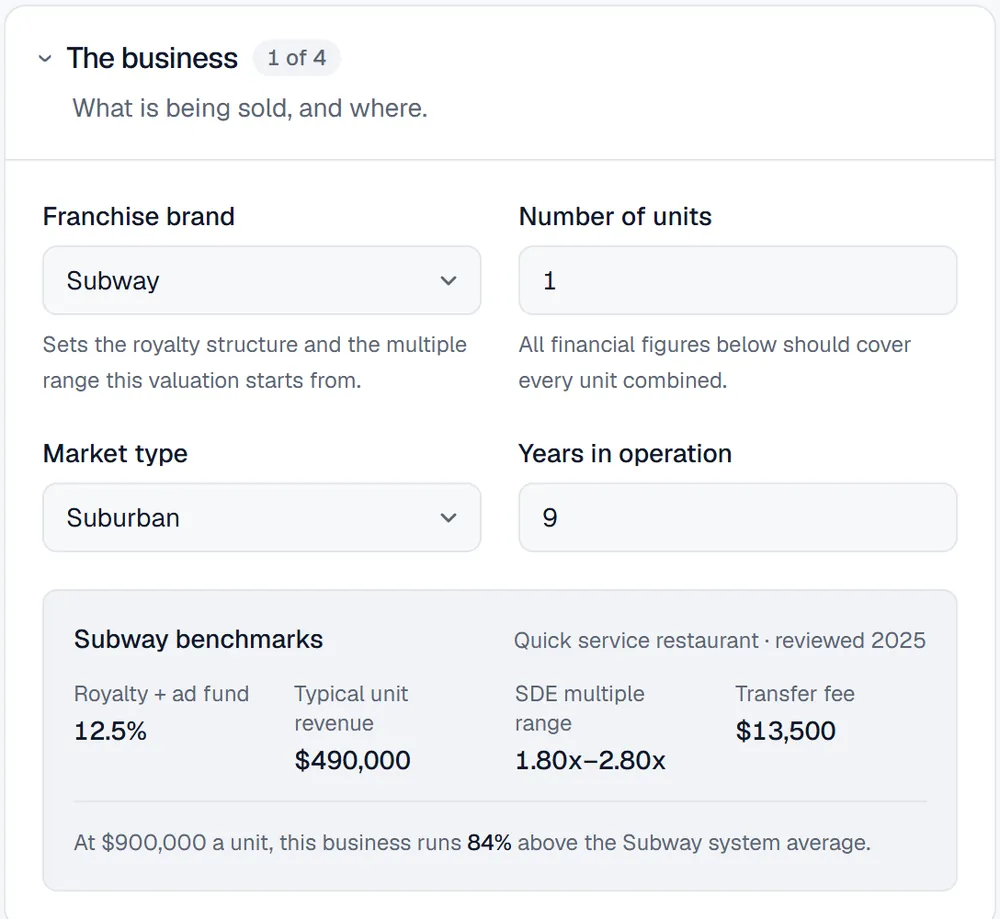
Pick the brand
The calculator loads that system’s royalty and ad fund rate, typical unit revenue, the SDE multiple range units trade at and the transfer fee, and tells you how this location compares with the system average.
-
Step 2
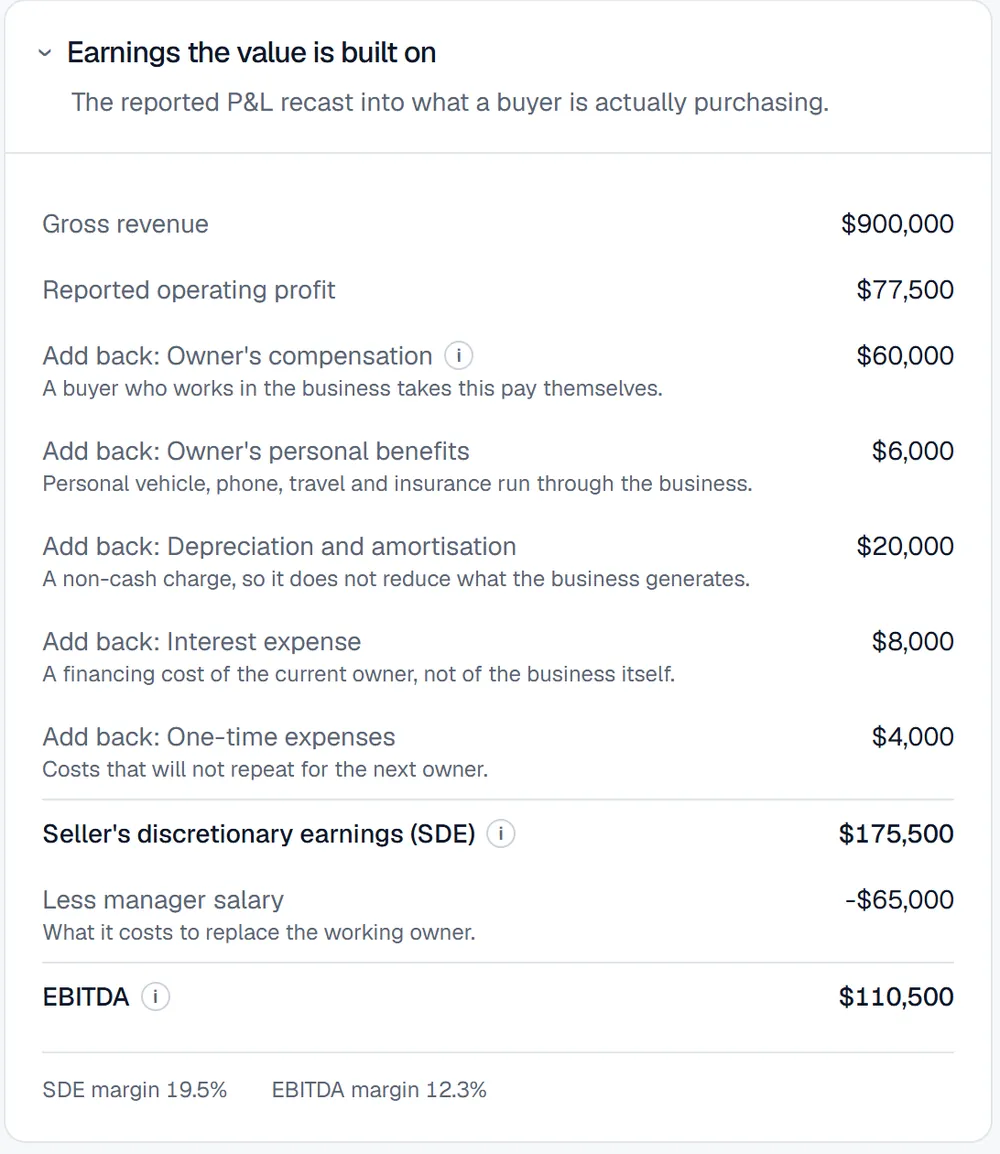
Recast the P&L the way a buyer reads it
Reported profit, then each add-back with a line on why it counts: owner’s pay, personal costs, depreciation, interest, one-time expenses. That gives seller’s discretionary earnings. Take out a manager’s salary and you have EBITDA.
-
Step 3
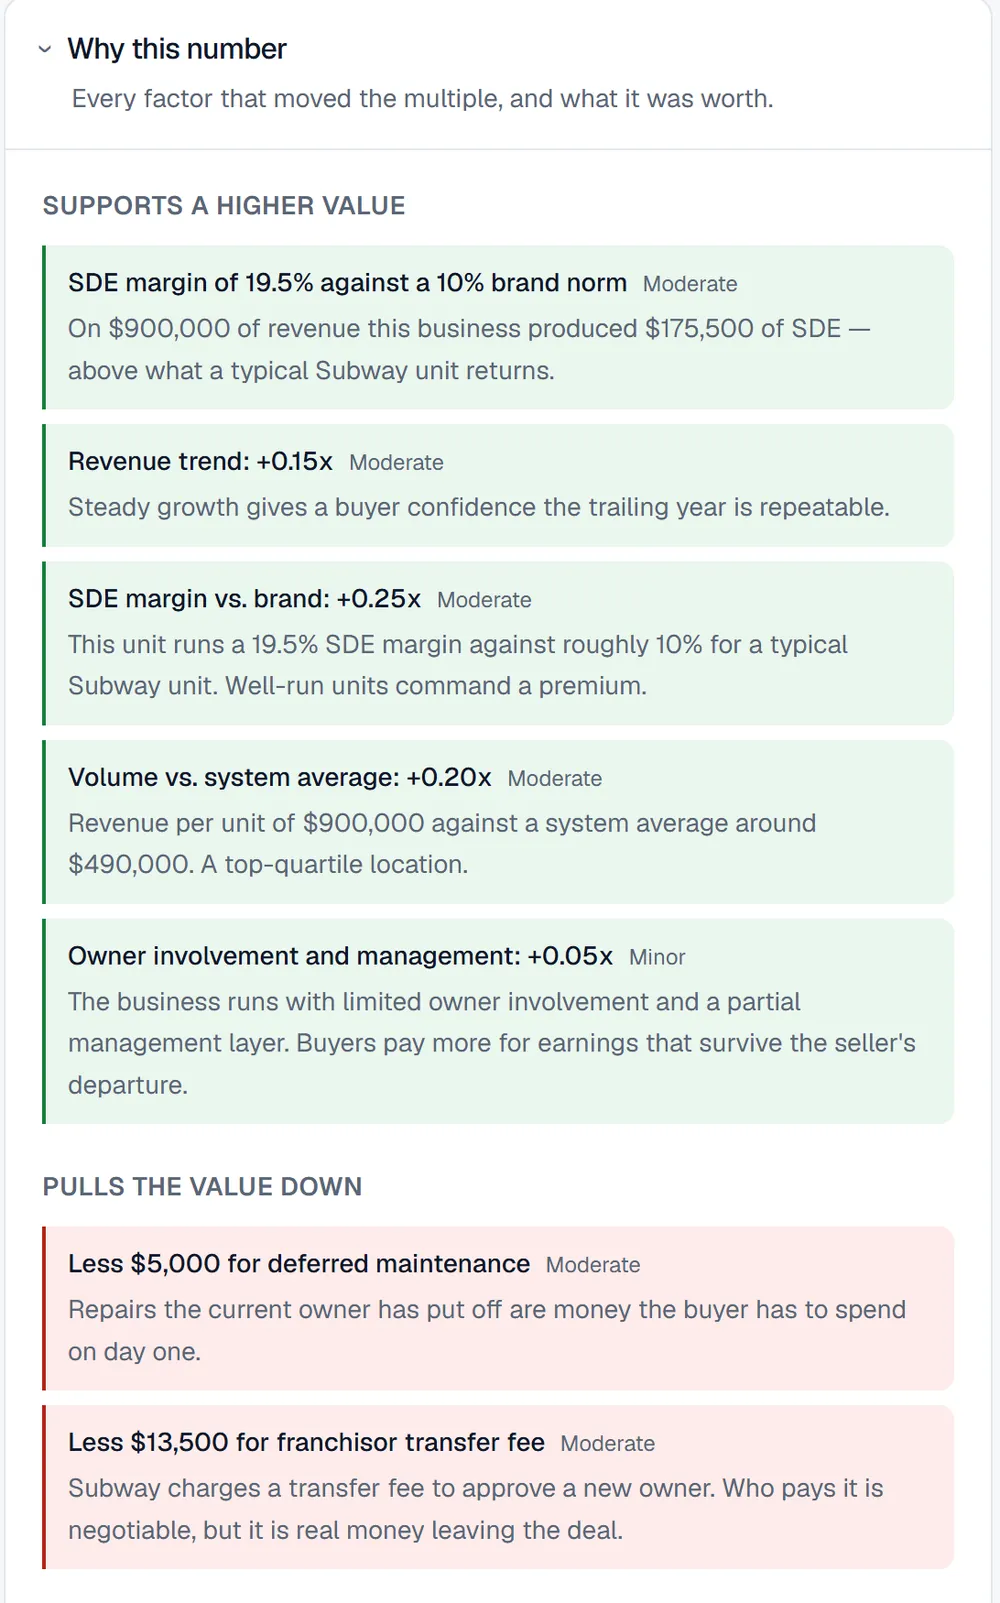
Move the multiple, and say why
Every factor that moved the multiple is listed with what it was worth: margin against the brand norm, revenue trend, volume, owner involvement. What pulls the value down is listed too.
-
Step 4
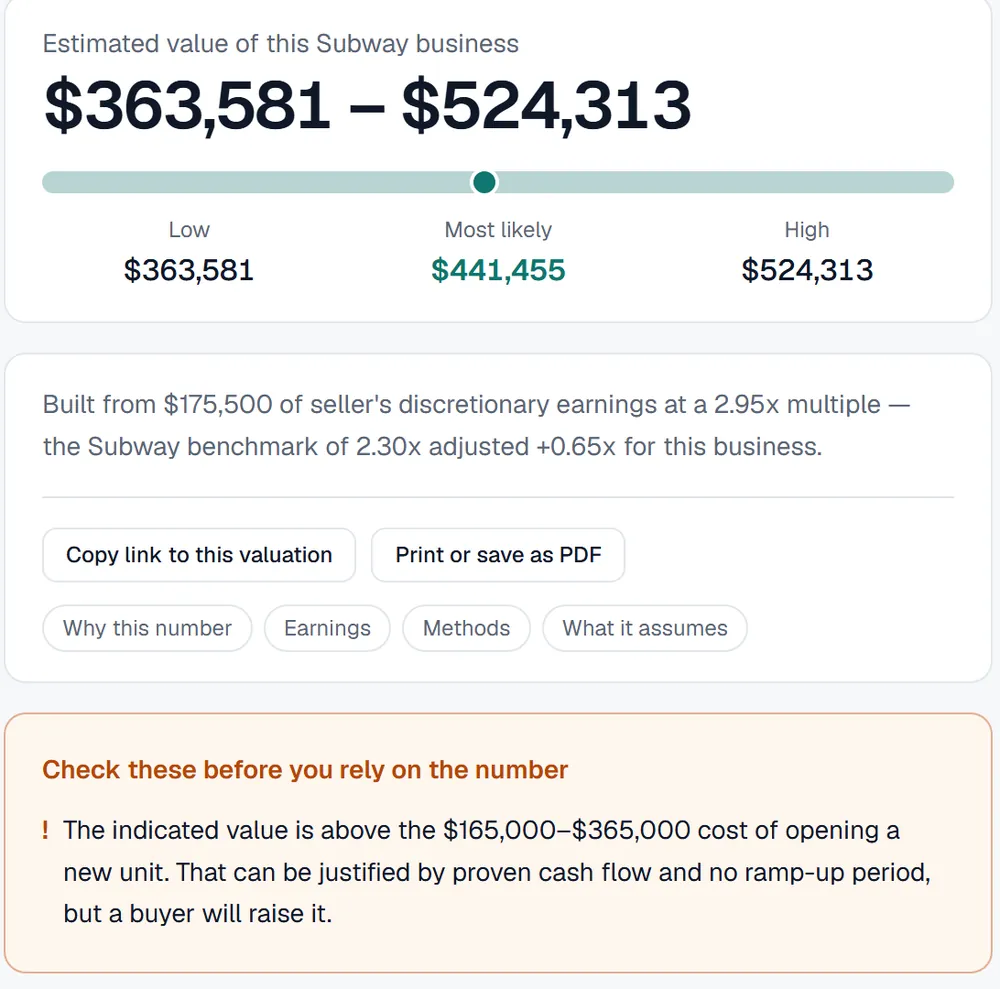
Read the range, and the warnings
A low, most-likely and high value, the sentence that explains it, and anything to check before you rely on it. Here, the value sits above the cost of opening a new unit, which a buyer will raise.
Four methods, weighted to the buyer
Who would realistically buy decides how much each method counts. In the example, a single unit where the buyer steps into the owner’s job, earnings carry most of the weight.
- SDE multiple 55%
- Seller’s discretionary earnings times a multiple drawn from what units in that system trade at. The main basis for an owner-operated resale.
- EBITDA multiple 20%
- The same earnings less a market-rate manager’s salary, priced the way an investor who won’t run the place would price it.
- Discounted cash flow 25%
- A multi-year projection brought back to today: a sanity band on the earnings methods, not the answer.
- Asset value floor
- Equipment, leasehold improvements, inventory and deposits. A floor under the range, checked against the cost of opening a new unit.
Why it starts from the brand
A generic small-business multiple gets franchises wrong. Royalty and ad fund obligations differ widely between systems. The years left on the franchise agreement can be worth more than a turn of earnings. Some franchisors won’t approve a single-unit buyer at all.
So the calculator begins with the benchmarks for the brand you pick, then adjusts for what makes this location different: its margin against the brand norm, its volume against the system average, its trend, and how much it depends on the owner.
Have these in front of you about five minutes
- Last year’s P&L. Revenue and every expense line.
- What the owner takes out. Pay, personal costs, depreciation, interest, one-offs.
- The deal terms. Years left on the agreement and the lease, any remodel coming.
Notes
- An estimate for planning and negotiation, not a formal appraisal, and nothing in it is investment, tax or legal advice. Brand benchmarks are illustrative industry ranges: check them against the current Franchise Disclosure Document and real comparable sales before relying on a number.
- No account and no sign-up. Your figures stay in your browser.
- “Copy link to this valuation” puts the figures inside the link, so send it only to people you would show the numbers to. “Print or save as PDF” keeps a copy.
- Two advanced sections let you override the brand benchmarks and the discounted cash flow assumptions. The assumptions page shows where each brand’s multiple range comes from.
- Missing a figure? Start anyway. The range appears once revenue and the expense lines are in; everything else narrows it.
Run your own numbers.
Open the calculator